Turning Prometheus data into metrics for alerting
As you may have seen in previous blog posts, we have a Warboard in our office which shows the current status of the servers we manage. Most of our customers are using our new alerting stack, but some have their own monitoring solutions which we want to integrate with. One of these was Prometheus. This blog post covers how we transformed raw Prometheus values into percentages which we could display on our warboard and create alerts against.
Integrating with Prometheus
In order to get a summary of the data from Prometheus to display on the Warboard we first needed to look at what information the Node Exporter provided and how it was tagged. Node Exporter is the software which makes the raw server stats available for Prometheus to collect. Given that our primary concerns are CPU, memory, disk IO and disk space usage we needed to construct queries to calculate them as percentages to be displayed on the Warboard.
Prometheus makes the data accessible through its API on "/api/v1/query?query=<query>". Most of the syntax is fairly logical with the general rule being that if we take an average or maximum value we need to specify "by (instance)" in order to keep each server separate. Node Exporter mostly returns raw values from the kernel rather than trying to manipulate them. This is nice as it gives you freedom to decide how to use the data but does mean we have to give our queries a little extra consideration:
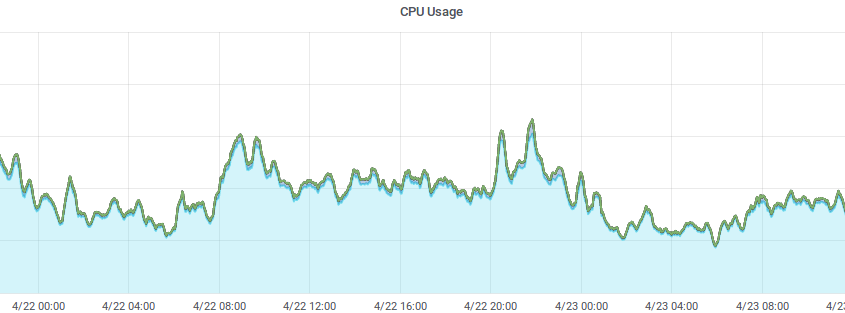
CPU
(1 - avg(irate(node_cpu{mode="idle"}[10m])) by (instance)) * 100
CPU usage is being reported as an integer that increases over time so we need to calculate the current percentage of usage ourselves. Fortunately Prometheus has the rate and irate functions for us. Since rate is mostly for use in calculating whether or not alert thresholds have been crossed and we are just trying to display the most recent data, irate seems a better fit. We are currently taking data over the last 10 minutes to ensure we get data for all servers, even if they’ve not reported very recently. As total CPU usage isn’t being reported it is easiest use the idle CPU usage to calculate the total as 100% – idle% rather than trying to add up all of the other CPU usage metrics. Since we want separate data for each server we need to group by instance.
Memory
((node_memory_MemTotal - node_memory_MemFree) / node_memory_MemTotal) * 100
The memory query is very simple, the only interesting thing to mention would be that MemAvailable wasn’t added until Linux 3.14 so we are using MemFree to get consistent values from every server.
Disk IO
(max(avg(irate(node_disk_io_time_ms[10m])) by (instance, device)) by (instance))/10
Throughout setting up alerting I feel disk IO has been the “most interesting” metric to calculate. For both Telegraf, which we discuss setting up here, and Node Exporter I found looking at the kernel docs most useful for confirming that disk “io_time” was the correct metric to calculate disk IO as a percentage from. Since we need a percentage we have to rule out anything dealing with bytes or blocks as we don’t want to benchmark or assume the speed of every disk. This leaves us with “io_time” and “weighted_io_time”. “weighted_io_time” might give the more accurate representation of how heavily disks are being used; it multiplies the time waited by a process, by the total number of processes waiting. However we need to use “io_time” in order to calculate a percentage or we would have to factor in the number of processes running at a given time. If there are multiple disks on a system, we are displaying the disk with the greatest IO as we are trying to spot issues so we only need to consider the busiest device. Finally we need to divide by 1000 to convert to seconds and multiply by 100 to get a percentage.
Disk Space
max(((node_filesystem_size{fstype=~"ext4|vfat"} - node_filesystem_free{fstype=~"ext4|vfat"}) / node_filesystem_size{fstype=~"ext4|vfat"}) * 100) by (instance)
As Node Exporter is returning 0 filesystem size for nsfs volumes and there are quite a few temporary and container filesystems that we aren’t trying to monitor, we either need to exclude ones we aren’t interested in or just include those that we are. As with disk IO, many servers have multiple devices / mountpoints so we are just displaying the fullest disk, since again we are trying to spot potential issues.
It’s worth noting that newer versions of Node exporter have slightly updated the metric names. For example, instead of node_cpu you’ll now want node_cpu_seconds_total, you can see some of our other updates to the above queries in this code.
If you are looking to set-up your own queries I would recommend having a look through the Prometheus functions here and running some ad hoc queries from the "/graph" section of Prometheus in order to look at what data you have available.
If you need any help with Prometheus monitoring then please get in touch and we’ll be happy to help.